
| Buy & Hold | SPW | |
|---|---|---|
| PNL | 6,778 | 7,820 |
| OK | n/a | 91.7% |
| DrDwn | 18.9% | 17.6% |
| Cagr | 19.0 | 21.5 |
Closed Ops: 12 – Won: 11 Lost: 1
Profit Ratio: 7274%
System Quality Number: 3.3
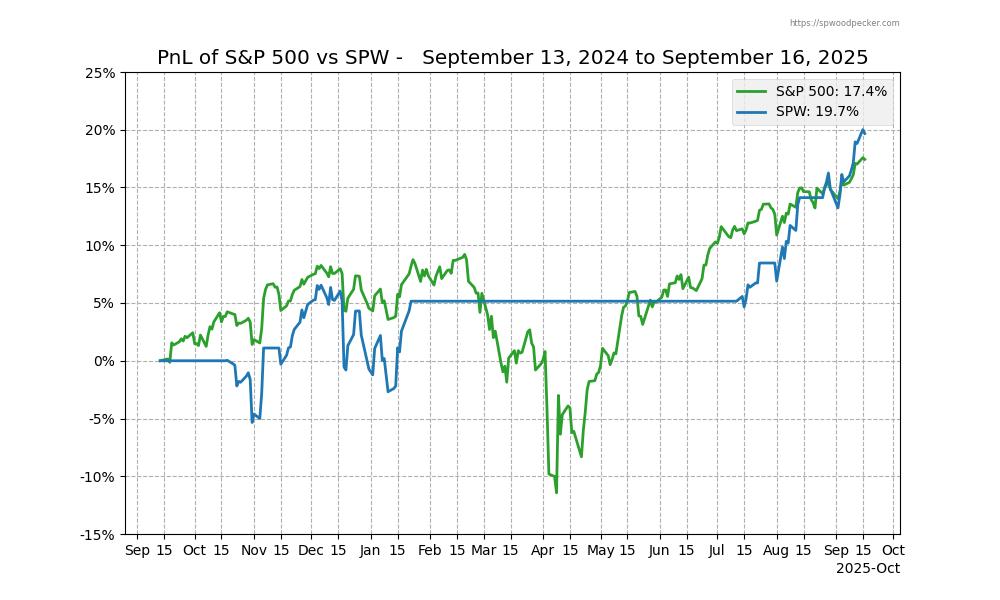
Performance Summary: SPW Strategy vs. Buy & Hold
SPW, our S&P500 Trading System continues to provide a high return rate of 21.5%, with less drawdown than a Buy & Hold approach: 17.6 SPW vs. 18.9 Buy & Hold. It currently maintains a win rate of 91.7, with 11 wins and only 1 losses.
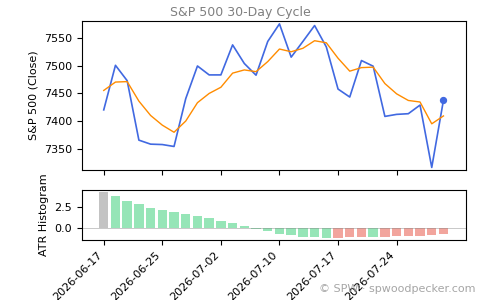
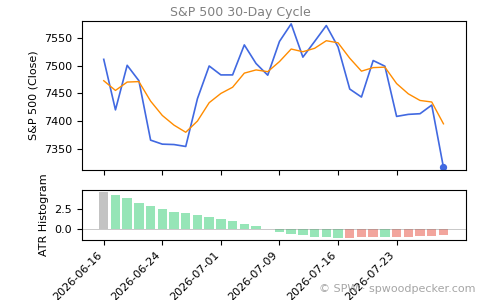
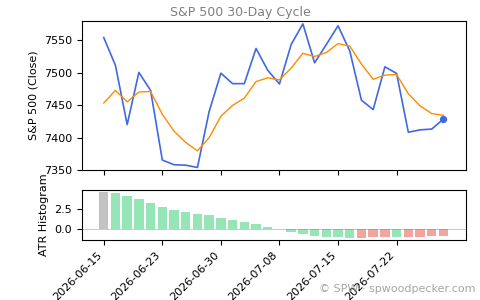
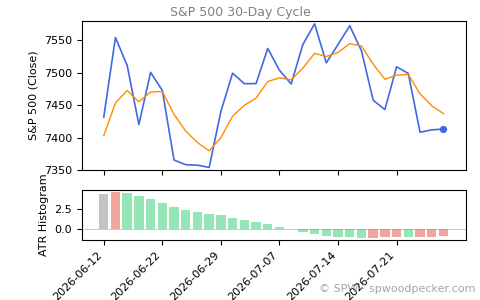
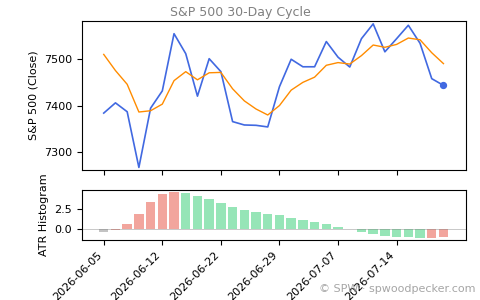
Volatility Analysis
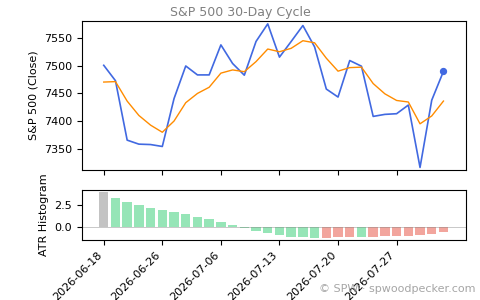
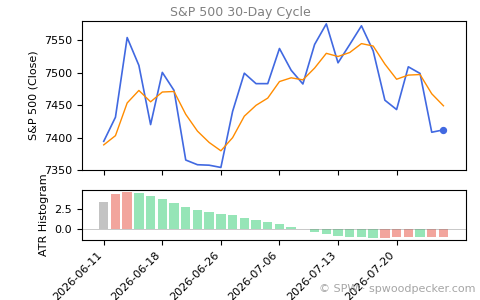
Volatility wave is currently in phase 4 — Exhaustion Zone.
As of July 31, 2026, SPX rose +0.70%. The market is on the bottom stage of the cycle, where traders look for new balance, and short-term swings are intensifying.
© SPW · spwoodpecker.com