
Traded Asset, Rules, and Permormance
Goal: Outperform the SP500
SPW is a trading system designed to make money while minimizing losses. It can outperform the SP500 while having lower drawdowns as compared to a buy and hold strategy in the index.
Why Trade an Index
Trading on an index has significant advantages over picking individual stocks:
a) Volatility is lower because the daily price fluctuations of the components are averaged out, resulting in smaller hiccups.
b) Indexes comprise the best companies and there are strict rules in order to be included in them. Periodically, new companies with the best performance replace the worst ones. This process keeps the most profitable companies in the index, and that tends to increase its value over the long term.
c) They are simple to track. Their real time value is found in multiple news sources. There is no need to check specialized financial outlets or suscription services.
This being said, an index cannot be traded, it is just a computed value based on the price and weight of its components, but it is possible to operate with financial products that track the index value. SPW trades SSO, which is a exchange-traded fund (ETF) that follows the value of the SP500 index. More information about can be found here: SSO Fact Sheet. SSO is chosen for SPW because it is leveraged, and built with swaps, which allow it to accurately track the index value. Retail investors of the European Union, are not allowed to trade SSO, but an alternative is provided here.
Rules for Trading
SPW is based on the following rules:
- Enter when price is dropping
- Exit when price is climbing
- Do not enter during down trends
- No stop loss / profit levels are used
These rules mean that SPW does not behave as a swing trader, trying to keep with the upswings of the market untill they reach their maximum. Instead, it leaves the party early. This confers SPW a high probability of not losing in an unexpected reversal.
The intent is to avoid risk and, simultaneously, compound the gains of several trades. This allows SPW to beat the underlaying asset on the long run. When the SP500 is in a strong uptrend, SPW may lag behind, but when things turn risky, it will stay on the side, and usally ends up achieving better results.
Performance of SPW vs SP500
Following is a comparative chat of the performance of a buy and hold strategy on SSO vs using the SPW strategy:
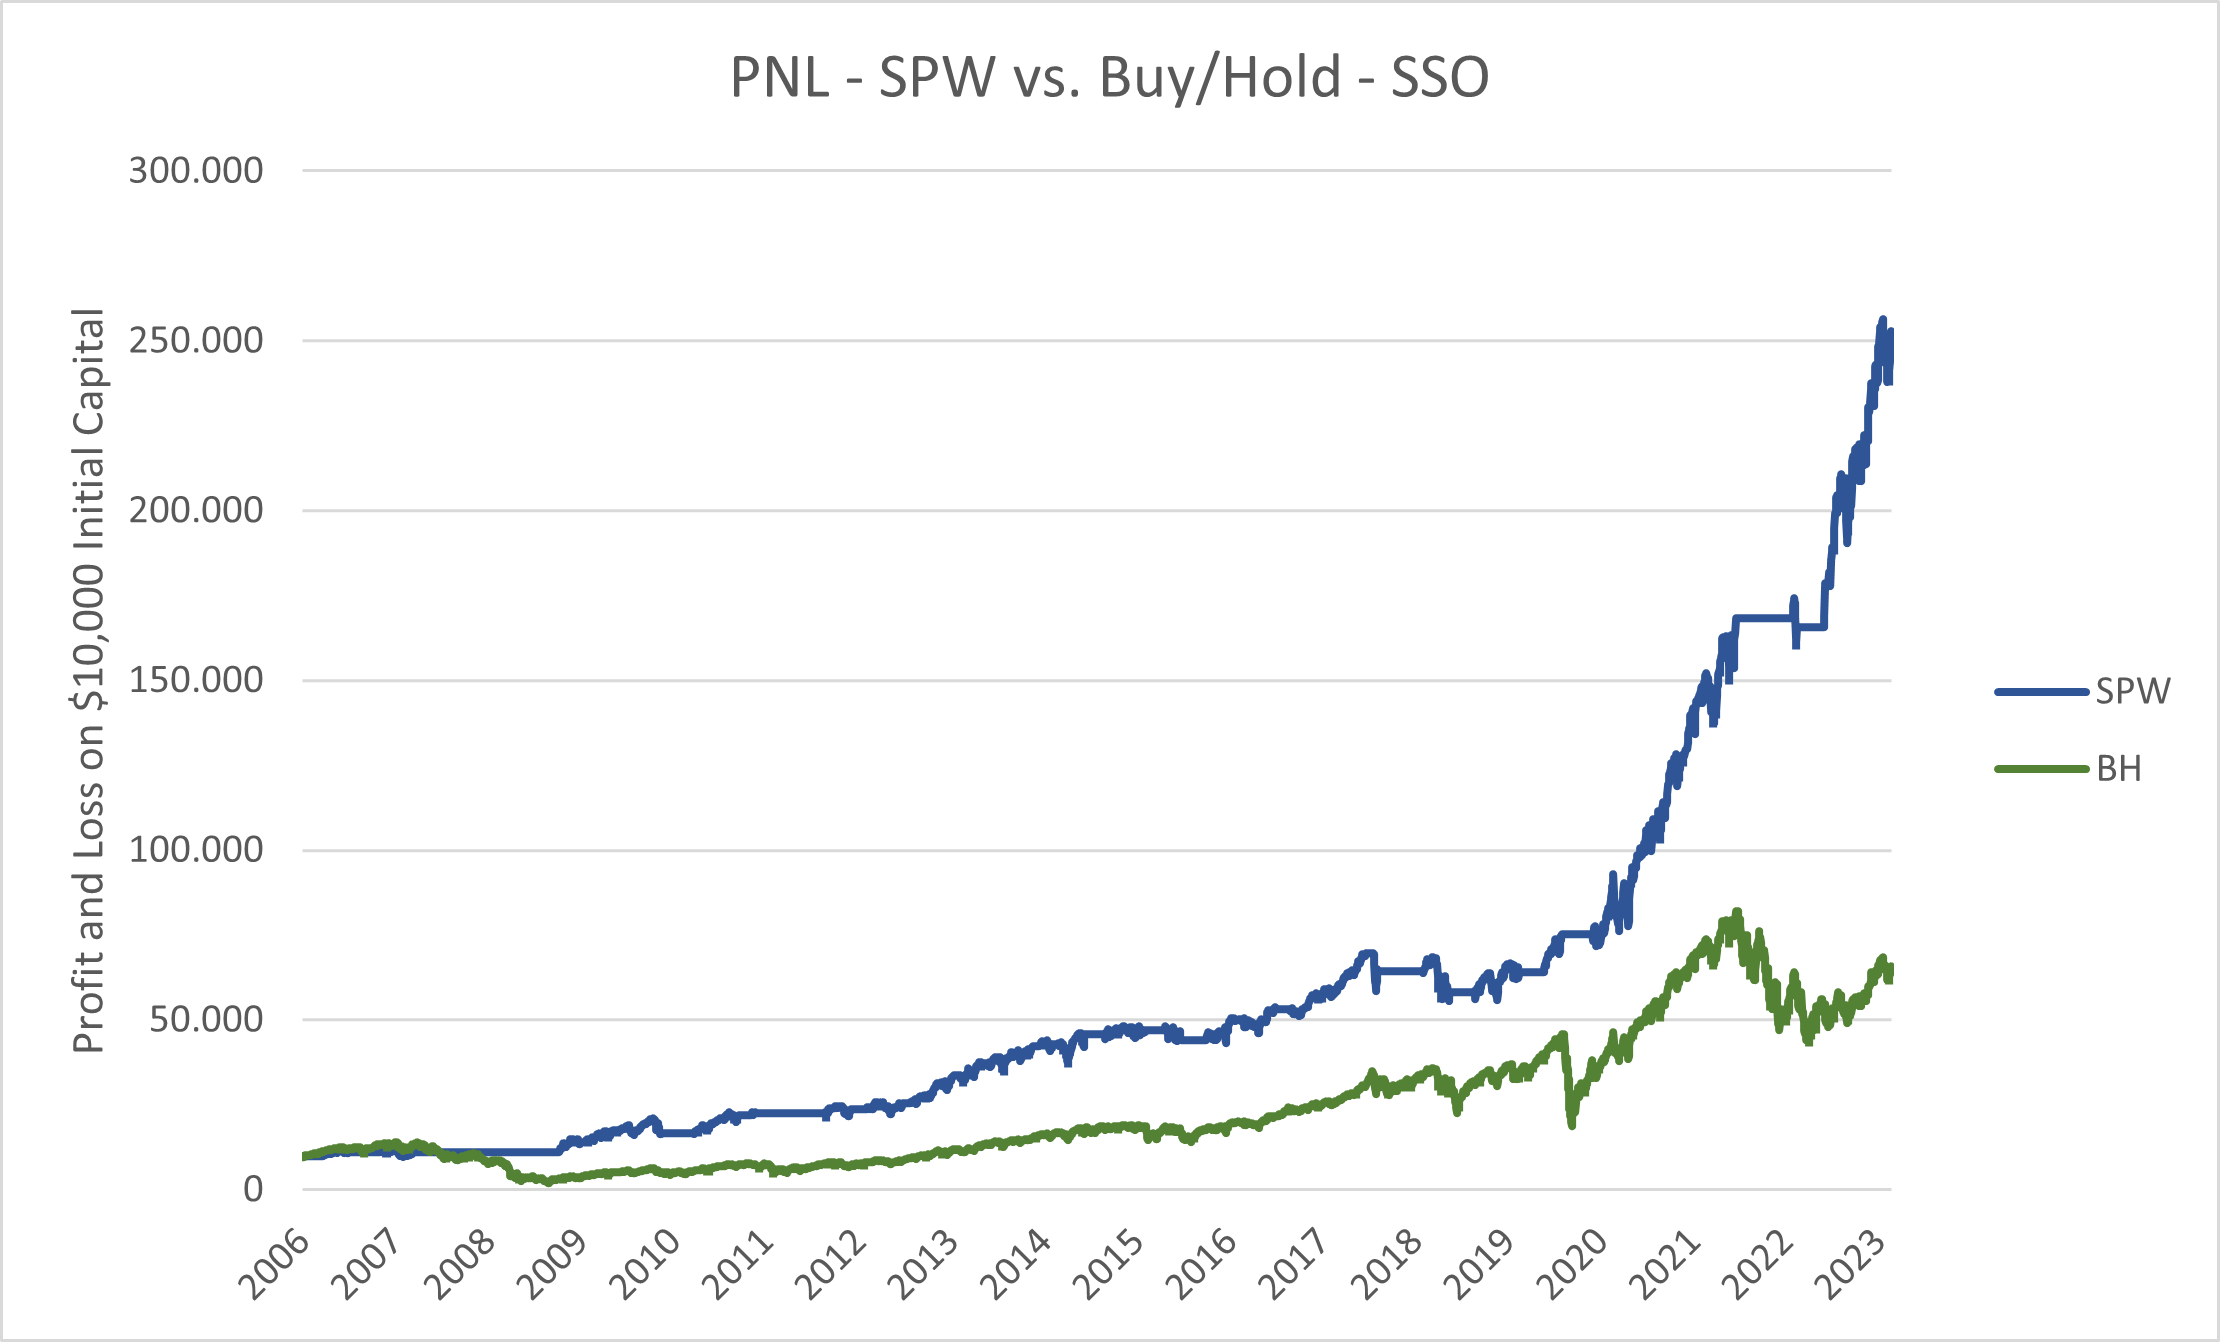
In a buy-and-hold strategy, if someone bought SSO in 2006, they would have experienced a significant drop of 85% (March 9, 2009). On the other hand, SPW was able to minimize losses by staying out during down trend periods.
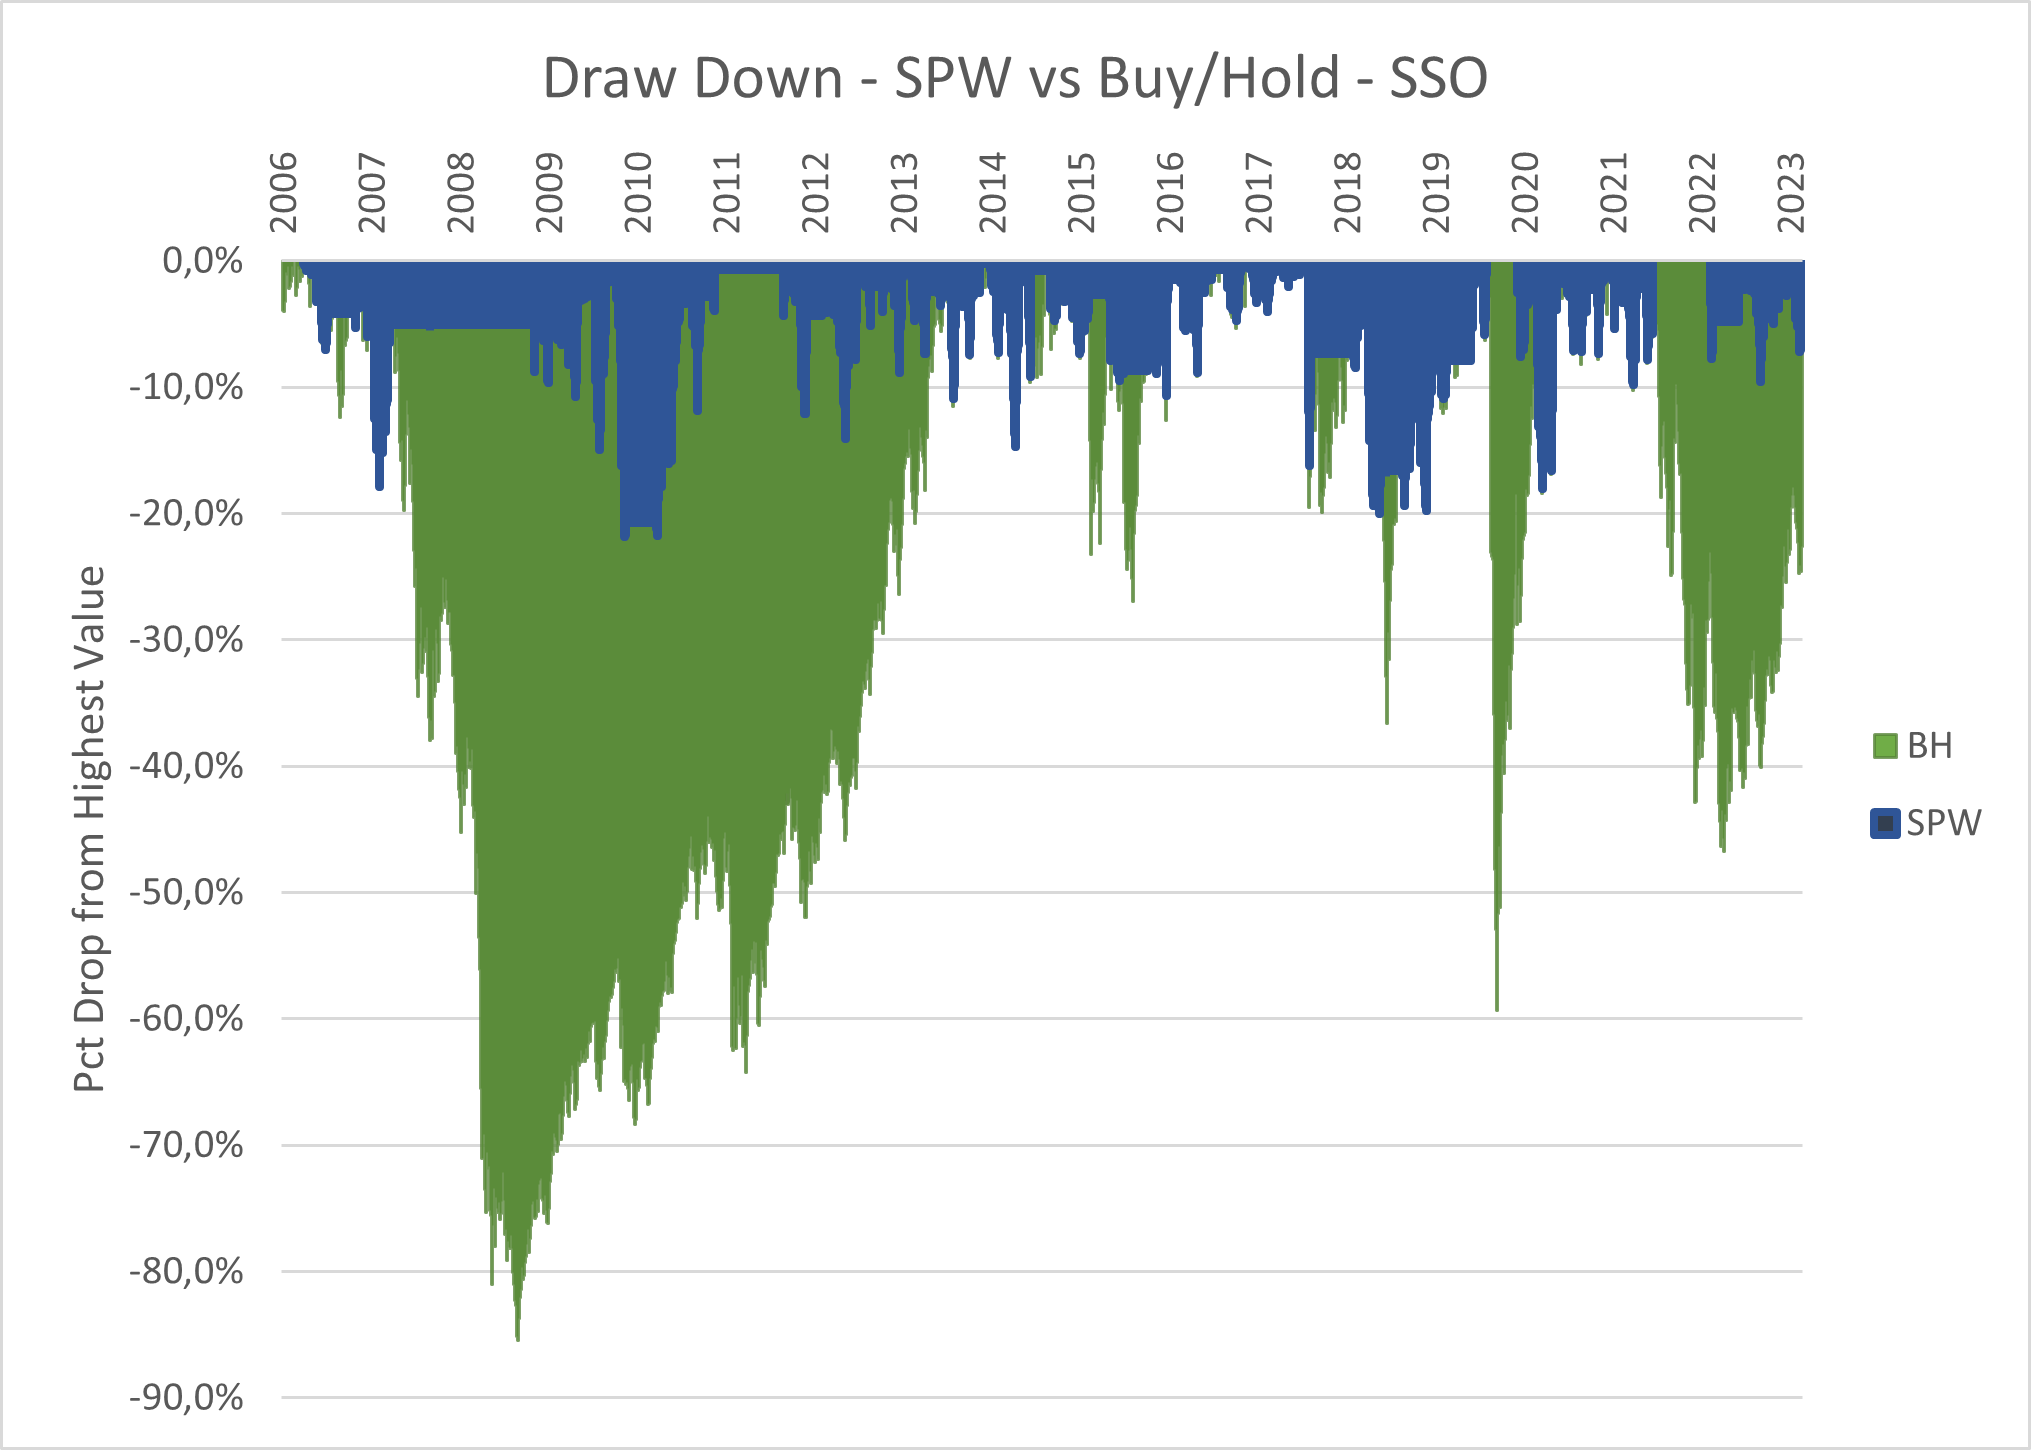
This is shown in the figure below, where SPW consistently has smaller losses compared to a buy-and-hold strategy:
Trading Assumptions
- 95% of the available capital is used in every operation
- Commission for buying and selling is 0.1%
- All orders are issued at Market Price on next session’s Market Open
Backtesting Results for SPW
In the period from August 11th, 2006 to October 16th, 2023, the strategy outputs the following results:
| Total Closed | Total Won | Total Lost | Profit Ratio |
| 56 | 43 | 13 | 140% |
| Drawdown | PnL Net | SQN | CAGR |
| 21.9% | 233,281 | 4.1 | 20.3% |
Avoiding Overfitting of Trading System
Care has been taken to avoid the use of an excessive number of parameters. The system uses five, two of which are internal and invariant for all the backtested stocks. All other stocks have shown similar behaviour, achieving a significant reduction in drawdown.
After six months of operation, the system has behaved normally, and is inline with the backtesting results. This blog is set to log all the operations and verify that the system is stable and capable of achieving consistent results.
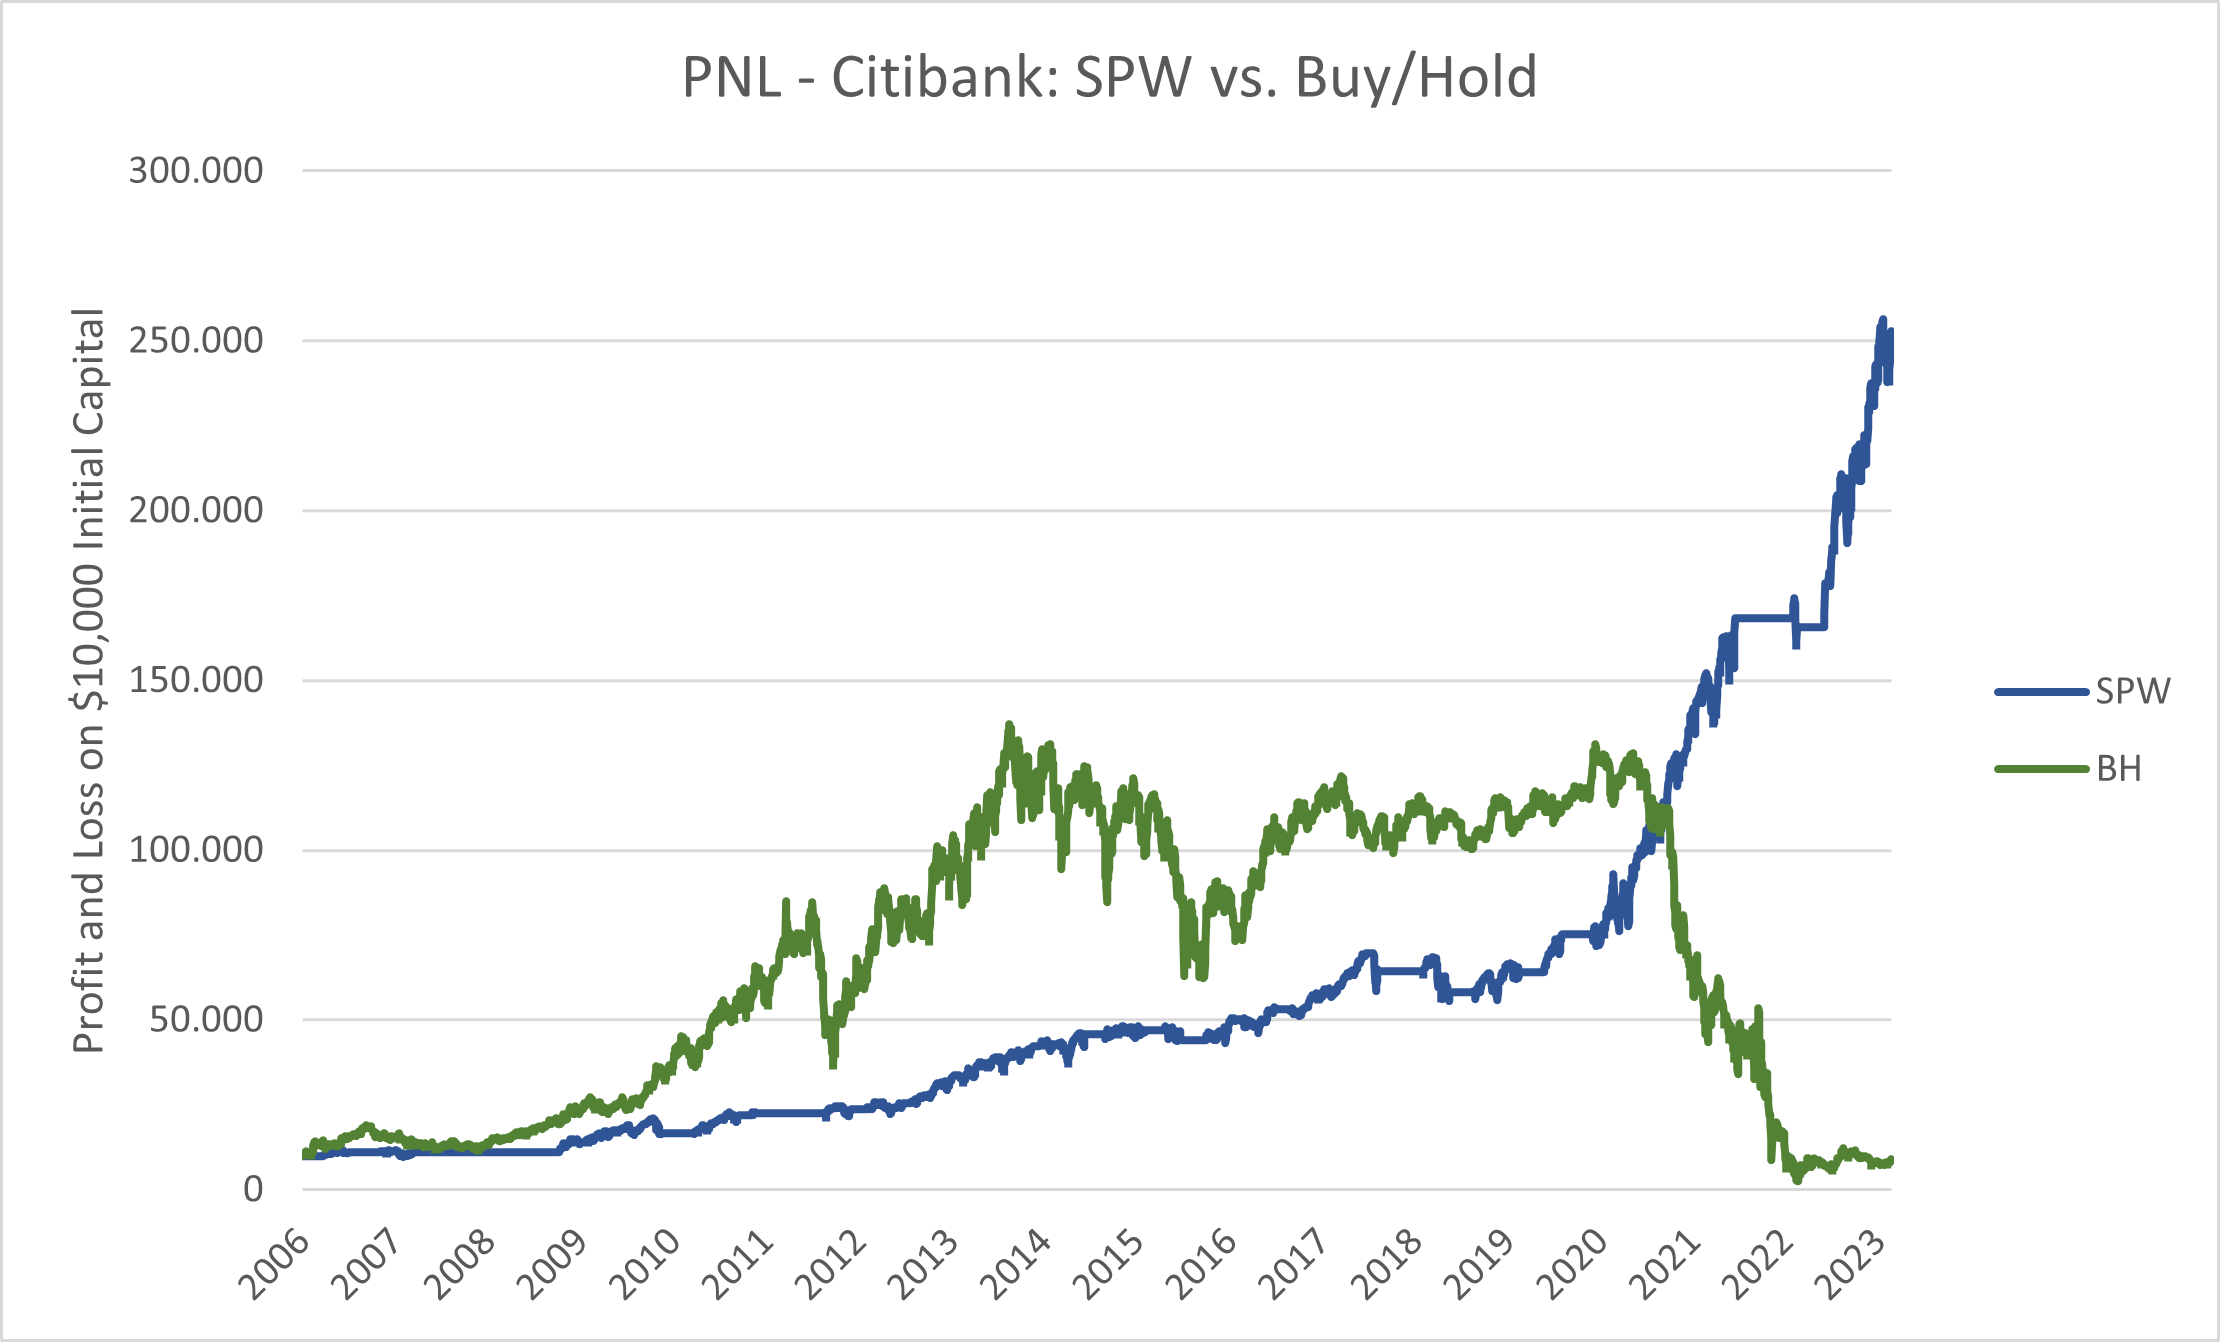
In all cases (over 50 different stocks and ETFs tested) SPW achieved significantly lower losses. PnL wise, SPW will fall behind BH during uptrends and will be better during downtrends. The following figure shows an extreme case, CitiBank. Someone that bought and held $10,000 on June 2006 would have reached a peak PnL of $137,072 in 2014, vs $39,486 for SPW. But, as of October 10, 2023, the BH strategy would be worth only $10,617 vs $234,929 for SPW.
The consistent performance of SPW accross very different assets suggests that there is no overfitting in the model, and that is expected to be the outcome of the test being logged in this blog.