Despite a 4-day downtrend, the system is holding a position based on earlier signals.
The system entered a long position on Dec 31, 2025 at 58.83. As of today’s close, the price is 58.13 showing a gain of -1.2%.
SPW S&P500 Trading Strategy comparison vs. Buy and Hold
Below, we compare the performance of SPW versus a Buy & Hold approach. Our SP500 Trading Strategy will trade SSO, while the Buy and Hold would trade any S&P500-based ETF such as SPY. The comparison starts on 11, Aug 2023
SPW, our S&P500 Trading System continues to provide a high return rate of 1891.6%, with less drawdown than a Buy & Hold approach: 16.0 SPW vs. 18.9 Buy & Hold. It currently maintains a win rate of 91.7, with 11 wins and only 1 losses.
Volatility Analysis
Currently in Quadrant 2:
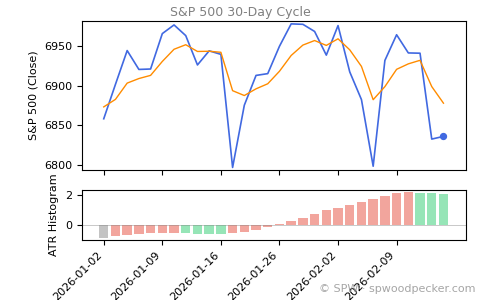
Volatility wave is currently in phase 2 — Stabilization Stage.
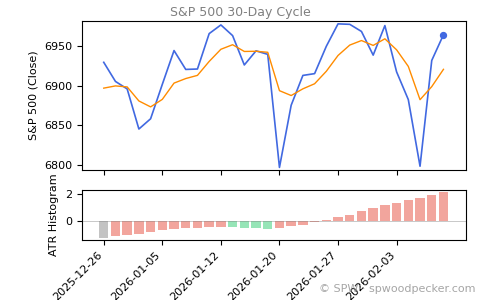
As of February 18, 2026, SPX rose +0.56%. The market is on the upper stage of the market cycle, showing confidence still dominates sentiment, and volatility is easing.
Despite a 2-day downtrend, the system is holding a position based on earlier signals.
The system entered a long position on Dec 31, 2025 at 58.83. As of today’s close, the price is 57.41 showing a gain of -2.4%.
SPW S&P500 Trading Strategy comparison vs. Buy and Hold
Below, we compare the performance of SPW versus a Buy & Hold approach. Our SP500 Trading Strategy will trade SSO, while the Buy and Hold would trade any S&P500-based ETF such as SPY. The comparison starts on 11, Aug 2023
SPW, our S&P500 Trading System continues to provide a high return rate of 1846.7%, with less drawdown than a Buy & Hold approach: 16.0 SPW vs. 18.9 Buy & Hold. It currently maintains a win rate of 91.7, with 11 wins and only 1 losses.
Volatility Analysis
Currently in Quadrant 2:
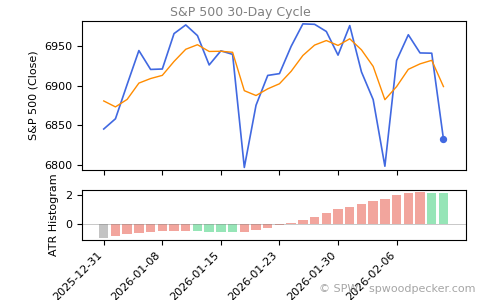
Volatility wave is currently in phase 2 — Stabilization Stage.
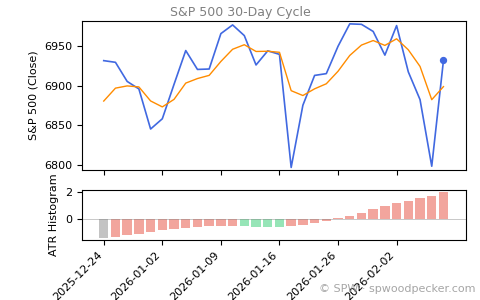
As of February 13, 2026, SPX rose +0.05%. The market is on the high phase of the cycle, where momentum remains positive, and the pace of movement is slowing.
Despite a 2-day downtrend, the system is holding a position based on earlier signals.
The system entered a long position on Dec 31, 2025 at 58.83. As of today’s close, the price is 57.41 showing a gain of -2.4%.
SPW S&P500 Trading Strategy comparison vs. Buy and Hold
Below, we compare the performance of SPW versus a Buy & Hold approach. Our SP500 Trading Strategy will trade SSO, while the Buy and Hold would trade any S&P500-based ETF such as SPY. The comparison starts on 11, Aug 2023
SPW, our S&P500 Trading System continues to provide a high return rate of 1846.7%, with less drawdown than a Buy & Hold approach: 16.0 SPW vs. 18.9 Buy & Hold. It currently maintains a win rate of 91.7, with 11 wins and only 1 losses.
Volatility Analysis
Currently in Quadrant 2:
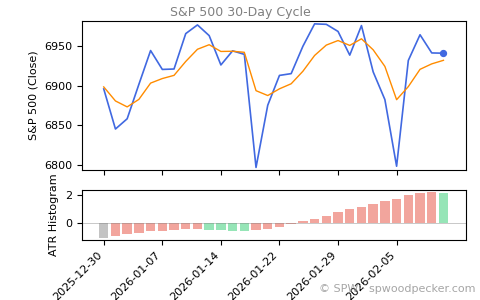
Volatility wave is currently in phase 2 — Stabilization Stage.
As of February 13, 2026, SPX rose +0.05%. The market is on the upper stage of the market cycle, showing confidence still dominates sentiment, and price action is becoming more orderly.
Despite a 1-day downtrend, the system is holding a position based on earlier signals.
The system entered a long position on Dec 31, 2025 at 58.83. As of today’s close, the price is 57.33 showing a gain of -2.5%.
SPW S&P500 Trading Strategy comparison vs. Buy and Hold
Below, we compare the performance of SPW versus a Buy & Hold approach. Our SP500 Trading Strategy will trade SSO, while the Buy and Hold would trade any S&P500-based ETF such as SPY. The comparison starts on 11, Aug 2023
SPW, our S&P500 Trading System continues to provide a high return rate of 1842.6%, with less drawdown than a Buy & Hold approach: 16.0 SPW vs. 18.9 Buy & Hold. It currently maintains a win rate of 91.7, with 11 wins and only 1 losses.
Volatility Analysis
Currently in Quadrant 2:
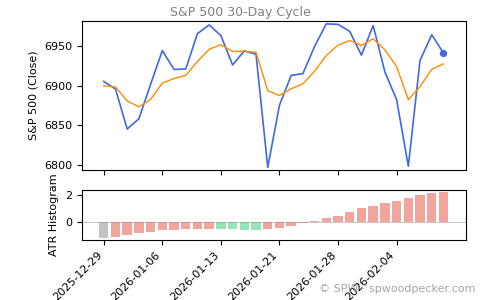
Volatility wave is currently in phase 2 — Stabilization Stage.
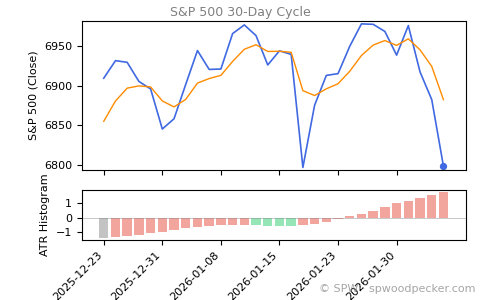
As of February 12, 2026, SPX fell -1.57%. The market is on the high phase of the cycle, where momentum remains positive, and the pace of movement is slowing.
The current uptrend has been active for 4 days, and the system remains invested while the momentum persists.
The system entered a long position on Dec 31, 2025 at 58.83. As of today’s close, the price is 59.22 showing a gain of 0.7%.
SPW S&P500 Trading Strategy comparison vs. Buy and Hold
Below, we compare the performance of SPW versus a Buy & Hold approach. Our SP500 Trading Strategy will trade SSO, while the Buy and Hold would trade any S&P500-based ETF such as SPY. The comparison starts on 11, Aug 2023
SPW, our S&P500 Trading System continues to provide a high return rate of 1991.9%, with less drawdown than a Buy & Hold approach: 16.0 SPW vs. 18.9 Buy & Hold. It currently maintains a win rate of 91.7, with 11 wins and only 1 losses.
Volatility Analysis
Currently in Quadrant 2:
Volatility wave is currently in phase 2 — Stabilization Stage.
As of February 11, 2026, SPX fell -0.00%. The market is on the upper side of the cycle, suggesting persistent optimism among investors, and the pace of movement is slowing.
The current uptrend has been active for 3 days, and the system remains invested while the momentum persists.
The system entered a long position on Dec 31, 2025 at 58.83. As of today’s close, the price is 59.19 showing a gain of 0.6%.
SPW S&P500 Trading Strategy comparison vs. Buy and Hold
Below, we compare the performance of SPW versus a Buy & Hold approach. Our SP500 Trading Strategy will trade SSO, while the Buy and Hold would trade any S&P500-based ETF such as SPY. The comparison starts on 11, Aug 2023
SPW, our S&P500 Trading System continues to provide a high return rate of 1990.6%, with less drawdown than a Buy & Hold approach: 16.0 SPW vs. 18.9 Buy & Hold. It currently maintains a win rate of 91.7, with 11 wins and only 1 losses.
Volatility Analysis
Currently in Quadrant 1:
Volatility wave is currently in phase 1 — Downthrust Phase.
As of February 10, 2026, SPX fell -0.33%. The market is on the upper stage of the market cycle, showing confidence still dominates sentiment, and price fluctuations are increasing.
The current uptrend has been active for 2 days, and the system remains invested while the momentum persists.
The system entered a long position on Dec 31, 2025 at 58.83. As of today’s close, the price is 59.56 showing a gain of 1.2%.
SPW S&P500 Trading Strategy comparison vs. Buy and Hold
Below, we compare the performance of SPW versus a Buy & Hold approach. Our SP500 Trading Strategy will trade SSO, while the Buy and Hold would trade any S&P500-based ETF such as SPY. The comparison starts on 11, Aug 2023
SPW, our S&P500 Trading System continues to provide a high return rate of 2021.5%, with less drawdown than a Buy & Hold approach: 16.0 SPW vs. 18.9 Buy & Hold. It currently maintains a win rate of 91.7, with 11 wins and only 1 losses.
Volatility Analysis
Currently in Quadrant 1:
Volatility wave is currently in phase 1 — Downthrust Phase.
As of February 09, 2026, SPX rose +0.47%. The market is on the upper side of the cycle, suggesting persistent optimism among investors, and volatility is expanding.
Yesterday I came across a Bloomberg headline on YouTube: “Nobel Laureate Paul Krugman Calls Bitcoin ‘Total Bust.’” The discussion suggested that crypto might be entering a legitimate “winter,” possibly driven by political factors and asset hoarding. It also raised an interesting question: if a collapse is going to happen, should it happen now — before Bitcoin becomes too interconnected with other asset classes?
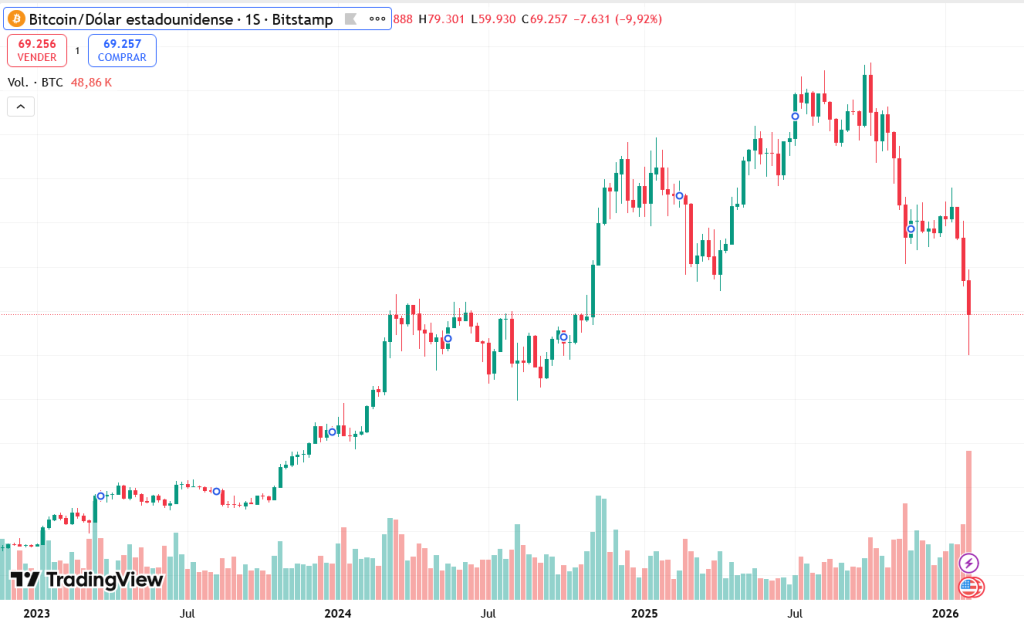
The video is in reference to the sharp price drop bitcoin has gone through lately. As seen in the following chart, BTC to USD has fallen from its $126K high of October 2025, and is curretly hovering around $70K.
Source: Trading View. Chart used for illustrative purposes.
With all due respect to Dr. Krugman, whose work I genuinely admire, reading this made me realize something simple: nobody — myself included — truly understands cryptocurrencies.
Public opinion tends to classify crypto into a few familiar categories:
channels for money laundering
a way to get rich quickly
“virtual gold”
would-be currencies that are rarely used in daily life
Meanwhile, governments are reacting in different ways. Some are worried about competition with their own digital currencies, introducing restrictions or stronger oversight of exchanges and transactions.
Recently, gold and the S&P 500 have performed strongly while Bitcoin has dropped sharply from last year’s peak and this drives speculation that miners could disappear because of falling prices. I don’t think that will happen.
Humans dislike unexplained events. When Bitcoin falls, we instinctively search for a narrative. Media outlets often provide one — sometimes before real evidence exists. A common claim today is that Bitcoin will eventually lose all value and investors will return exclusively to gold. Yet when we look closer, many large holders are not selling. A significant portion of trading volume comes from derivatives — futures, options, CFDs — rather than from people buying or selling actual coins.
Several factors play a role, but one stands out: leverage turns small movements into large oscillations — almost like resonance in a physical system.
A significant part of Bitcoin trading happens through derivatives where traders use leverage to control positions much larger than their actual capital. When prices move slightly, some positions are automatically liquidated. Those liquidations push the price further, triggering new liquidations in a feedback loop.
Because the underlying spot market is relatively thin compared to the size of leveraged positions, even modest flows from market makers or professional traders can create outsized price swings. What we often see is not massive buying or selling of real coins, but a chain reaction amplified by leverage.
In that sense, Bitcoin volatility is less about chaos and more about structure: a highly responsive system where small forces can produce large effects.
Will this drive Bitcoin’s value to zero? I don’t believe so. Coins lent into the market eventually have to be returned to their owners, and many long-term holders remain inactive. That dynamic alone may prevent permanent collapse and instead pull prices back toward some middle ground over time.
There is also another dimension rarely discussed. For some people, Bitcoin feels safer than gold — not necessarily as an investment, but as a portable store of value.
If you have traveled extensively through developing regions for work, you may recognize this situation: standing out in an immigration queue can lead to questions about carrying cash or precious metals. Declaring gold may be legal in some places, but transporting it can be risky. Cryptocurrencies, by contrast, can be secured without physically carrying anything visible.
This doesn’t make Bitcoin superior to gold — only different. In certain contexts, portability and discretion matter. Perhaps that is one reason why mining activity appears in regions where energy is cheap or capital mobility is restricted.
Even in developed countries, access to low-cost energy can make mining attractive as a long-term accumulation strategy. Taxes generally apply when converting to fiat currency, but until then the asset exists outside traditional financial structures.
I am not arguing that Bitcoin will replace existing systems, nor that it is free of risks. But despite volatility, criticism, and regulatory pressure, one thing seems clear to me:
Bitcoin is here to stay — not because everyone understands it, but because it answers needs that traditional assets do not always address.
The current uptrend has been active for 1 days, and the system remains invested while the momentum persists.
The system entered a long position on Dec 31, 2025 at 58.83. As of today’s close, the price is 58.98 showing a gain of 0.3%.
SPW S&P500 Trading Strategy comparison vs. Buy and Hold
Below, we compare the performance of SPW versus a Buy & Hold approach. Our SP500 Trading Strategy will trade SSO, while the Buy and Hold would trade any S&P500-based ETF such as SPY. The comparison starts on 11, Aug 2023
SPW, our S&P500 Trading System continues to provide a high return rate of 1983.8%, with less drawdown than a Buy & Hold approach: 16.0 SPW vs. 18.9 Buy & Hold. It currently maintains a win rate of 91.7, with 11 wins and only 1 losses.
Volatility Analysis
Currently in Quadrant 1:
Volatility wave is currently in phase 1 — Downthrust Phase.
As of February 06, 2026, SPX rose +1.97%. The market is on the higher region of the volatility wave, reflecting an extended rally, and market turbulence is picking up.
Despite a 2-day downtrend, the system is holding a position based on earlier signals.
The system entered a long position on Dec 31, 2025 at 58.83. As of today’s close, the price is 56.85 showing a gain of -3.4%.
SPW S&P500 Trading Strategy comparison vs. Buy and Hold
Below, we compare the performance of SPW versus a Buy & Hold approach. Our SP500 Trading Strategy will trade SSO, while the Buy and Hold would trade any S&P500-based ETF such as SPY. The comparison starts on 11, Aug 2023
SPW, our S&P500 Trading System continues to provide a high return rate of 1818.8%, with less drawdown than a Buy & Hold approach: 16.0 SPW vs. 18.9 Buy & Hold. It currently maintains a win rate of 91.7, with 11 wins and only 1 losses.
Volatility Analysis
Currently in Quadrant 1:
Volatility wave is currently in phase 1 — Downthrust Phase.
As of February 05, 2026, SPX fell -1.23%. The market is on the higher region of the volatility wave, reflecting an extended rally, and short-term swings are intensifying.